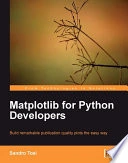
Matplotlib for Python Developers by Sandro Tosi introduces scientific and analytical plotting with Matplotlib. The book connects Python data with the figure elements used to present it, developing plots through worked examples. It examines both the construction of a chart and the adjustments needed to communicate its meaning, giving readers practical control over labels, axes and output.
What you will learn
- Build common analytical plots in Matplotlib
- Control axes, labels and figure layout
- Export graphics for reports and applications
Who this is for
Python programmers creating data graphics. Basic Python and familiarity with numerical data are useful.